Prior to 2018, handicapping at DRF was mostly done through reading DRF’s Print Publications of Past Performances ( or PPs, Data from horses Past Races, Track Conditions, Fractional Times, Race Types, Speed Figures etc.). Past Performances or PPs are used to make informed decisions about which horses are the best to bet on. In early 2017 DRF finished integrating web PPs through Adobe Flash, which quickly became a popular product. By 2018 DRF wanted to start bringing Past Performances to the web through modern web development approaches.
I was part of the ambitious team tasked to redesign the user experience and user interface as well as improve on prior iterations of DRF’s key handicapping Past Performances products.
Note: To comply with my non-disclosure agreement, I have omitted and obfuscated confidential information in this case study. All information in this case study is my own and does not necessarily reflect the views of DRF.
Introduction to product
So, who is DRF and what do they do?
DRF or The Daily Racing Form is a 125-year old flagship brand, is referred to as "America's Turf Authority since 1894", and is horse racing’s dominant media company. They are a national, multi-platform media, e-Commerce, and a wagering company providing premium data, authoritative editorial coverage, and betting technology to horse racing and sports enthusiasts in North America.
Via DRF.com, the leading online horse racing destination, and through its app and DRF Bets platform, Daily Racing Form offers a fully integrated and mobile-optimized digital experience for the modern horseplayer that seamlessly combines data, proprietary handicapping tools, premium content, video, and wagering, along with dedicated coverage serving the breeding industry.
Why did this project happen and was the goal/outcome?
This project happened because our team (UX research, data, and analytics team) identified product opportunities from a series of surveys and usability testing that concluded that 70.05% of users wanted a product that seamlessly combined handicapping, note-taking, bet construction, and race watching.
The goal and desired outcome were to create a differentiated, essential, frictionless ecosystem for horseplayers to drive wagering revenue through handicapping, note-taking, bet construction, and race watching all in one place.
Who are the users?
The research team and I had identified 4 types of DRF users: Seasonal or Event-Based Betters, Stats Customers, Regular Handicappers, VIP Bettors (Big Bettors). The users who my team and I are focused on for the handicapping product are the “Regular Handicappers”. These users are defined as people who use DRF’s past performance products to make informed decisions about which horses are the best to bet on.
My Role
I was responsible for working on the user interface and user experience for this product's mobile and desktop experience from 2018 to 2021 and collaborated with my creative director Dana Smith and UX/UI Intern Sarah Schaedler.
In addition, I worked alongside: Data Analysts, Product Managers, Business Analysts, front-end/back-end developers, and DRFs product owners.
As of today I am no longer continuing to work on this project and have moved on to other projects and opportunities. However, DRF is still intermittently updating its design with new UI/UX Designers based on user feedback and DRF business feedback.
This product launched globally in early January 2019 and is currently on DRF’s public domain via the purchase of DRF Classic or Formulator PPs.
Scope & Constraints
The scope of this initiative was a smaller piece of a much bigger project. The overall project goal was to improve and update DRF’s existing products and their entry points across the entire platform from DRF Store, Tournaments, News, Entries, Results, and Handicapping PPs. I was tasked to improve the usability, functionality, and desirability of Handicapping features.
Some unique and limiting factors for the project were: timing in terms of speed needed to meet client expectation, working in an agile design process, timing of delivery of designs for sprints, time zone difference between design/product team and development team, and making time for user research.
Some of the design constraints for this project is the design where: must be a responsive design, most also have a separate mobile experience, and the PPs statistical layout should remain the same as they have since 1894.
Phase 1
Research & Empathize
We began the process by conducting stakeholder interviews to better understand business goals, product limitations and to help better define the product. This was followed by market research, competitive analysis, and conducting user interviews to better understand and empathize with user needs.
Stakeholder Interviews
Market Research
Competitive Analysis
User Interviews
Market Research
Competitive Analysis
User Interviews
Stakeholder Interviews
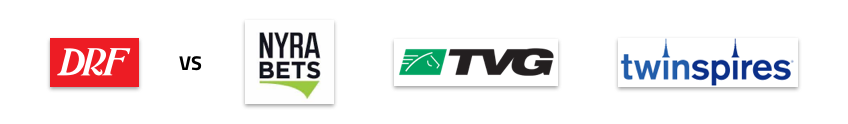
We conducted interviews on 3 Stakeholders whose roles were the following: Product Owner, Business Analyst, Data Analyst. From these interviews, we found the overall short-term business goal was to create a unified handicapping, betting experience. The longer-term Business goal was to grow the number of people using the product. According to the stakeholders, the users for Handicapping Past Performances were people who used DRF classic printable and legacy formulator products to make informed decisions on who could possibly win a race. Most common major competitors mentioned by stakeholders are Twinspires, TVG, and Nayra Bets. A common problem that was pointed out was lack of unity between betting and handicapping products. All stakeholders agree that the thing that gives DRF the best competitive advantage is the idea that DRF provides the oldest, most reliable Past Performances. When asked what is the unique value proposition for this product, most mentioned having the ability for handicapping, note-taking, bet construction, and race watching all in one place.
Market Research
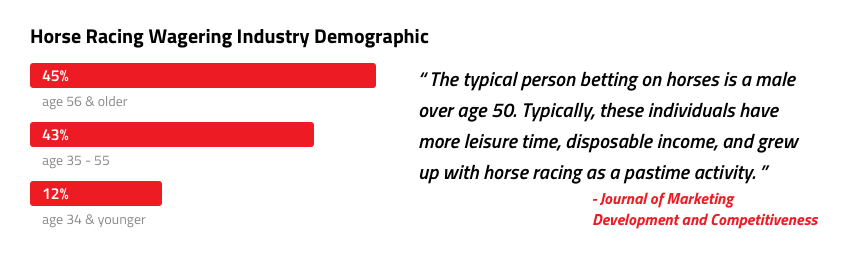
Research revealed that the main drive for users to use Handicapping products is the willingness to place a bet. The typical age of a horseplayer is a male over the age of 50, making up 45% of the market. Age ranges between 35-55 are 43% of the market and consumers aged 34 and younger make up 12%. There's a big need to bring in new customers in the younger demographic while keeping the betting space relatively the same to not lose the current older demographic.
Click to view details
Competitive Analysis
Next, we took a look at some of DRFs main direct competitors including Nyra Bets, Twinspires, and TVG. We were able to see the pros and cons of their platforms and apps to see where DRF fits in and what our competitors might be missing.
Click to view details
User Interviews
We then conducted several user interviews to collect information on the user's overall experience while using DRF all in one past performance and betting interface. Of the interviewees, 4 were male and 1 female. All the interviews were between the ages of 35 - 58,the user group DRF wanted to focus on in this phase of the product life cycle. Through these interviews, we were able to learn who the users are and the experiences they have while using DRF Legacy PPs. Also during these interviews, we were able to identify improvements, great ideas, and pain points from users.
Phase 2
Define
To better understand the target user group and cultivate empathy, we constructed an empathy map based on user interviews performed in the research phase. From there we were about to better understand user needs and most common patterns from users. This allowed us to create a target user persona and begin exploring possible solutions to user needs.
Empathy Map
Persona
POV Statements + HMW Question
Persona
POV Statements + HMW Question
Empathy Map
Through the interviews we performed, we were able to get a good understanding of user experiences, thoughts, and concerns with the DRF Legacy PPs. Using an empathy map we were able to better organize and understand these research findings. This helped us identify patterns and discover user insights and needs.
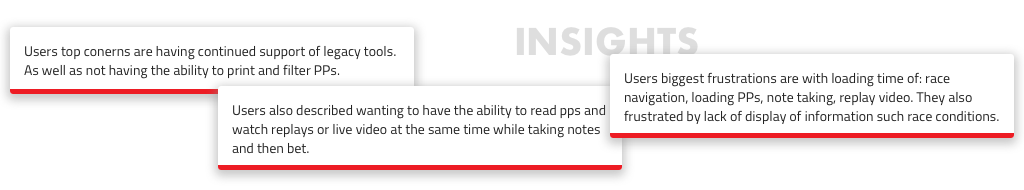
Click to view details
Persona
Next, we created a persona "Dwayne Hughes" based on the findings from the empathy map. Dwayne represents DRF’s target user. With Dwayne, we can better stay empathetic towards target users of DRF Handicapping Products.
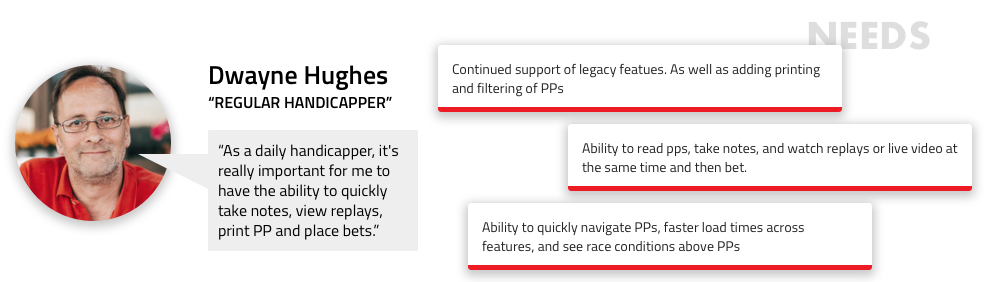
Click to view details
POV Statements + HMV Questions
After defining the target user, Dwayne, we needed to better understand how we can help Dwayne with DRF features and functionality. We created point-of-view statements and how-might-we questions to help encourage solutions for user needs.
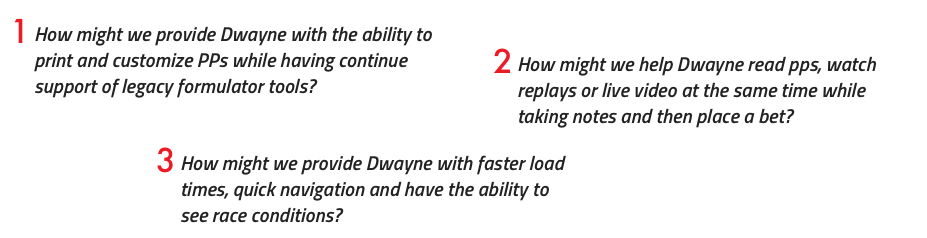
Click to view details
Phase 3
Ideate
Here we explored potential features keeping both business and user goals in mind through the process using a product roadmap. We then followed this up by visually seeing how a user might navigate through the app, interacting with potential features using a task flow, user flow, and wireframes.
Product Roadmap
Task Flow
User Flow
Mid-Fidelity Wireframes
Task Flow
User Flow
Mid-Fidelity Wireframes
Product Roadmap
After listing out POV statements and making how-might-we questions, we were able to think of potential features and create a product roadmap focusing on a few of those features presented.
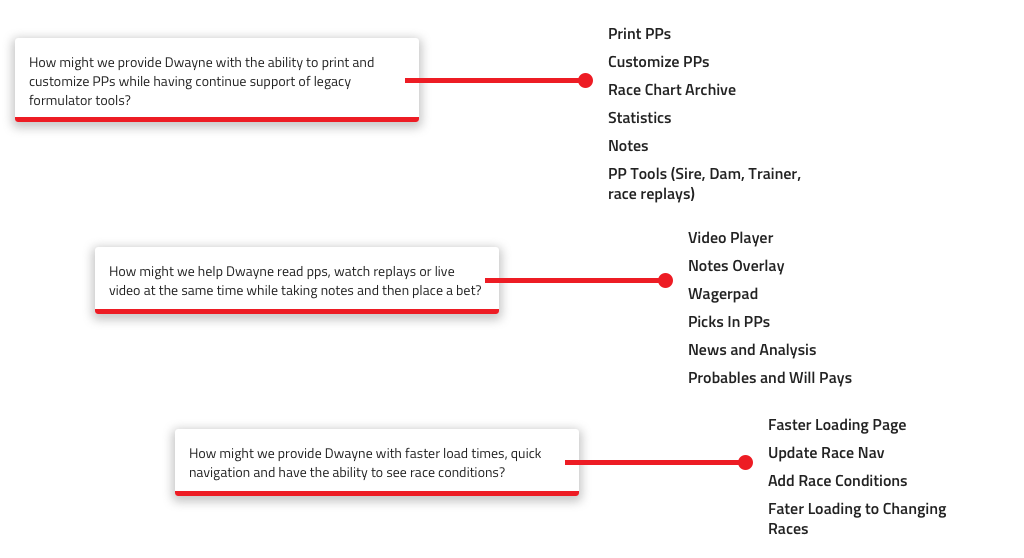
Click to view details
Task Flow
To better understand how users will navigate through the platform and perform specific tasks, we created a task flow diagram. This allowed us to think through the user's way of performing tasks and make sure all possible UI screens were designed to help the user perform the given task at hand.
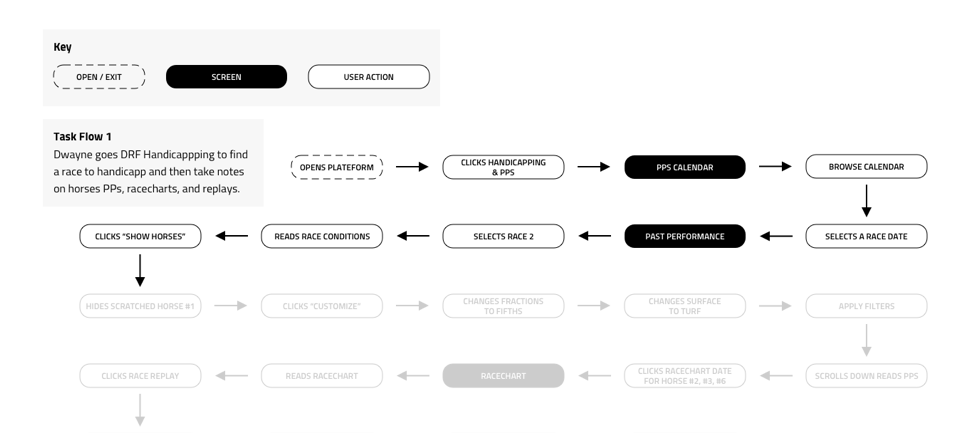
Click to view details
User Flow
We also created a user flow diagram. This helped us think through different scenarios a user might go through in the platform as they discover the information they are seeking.
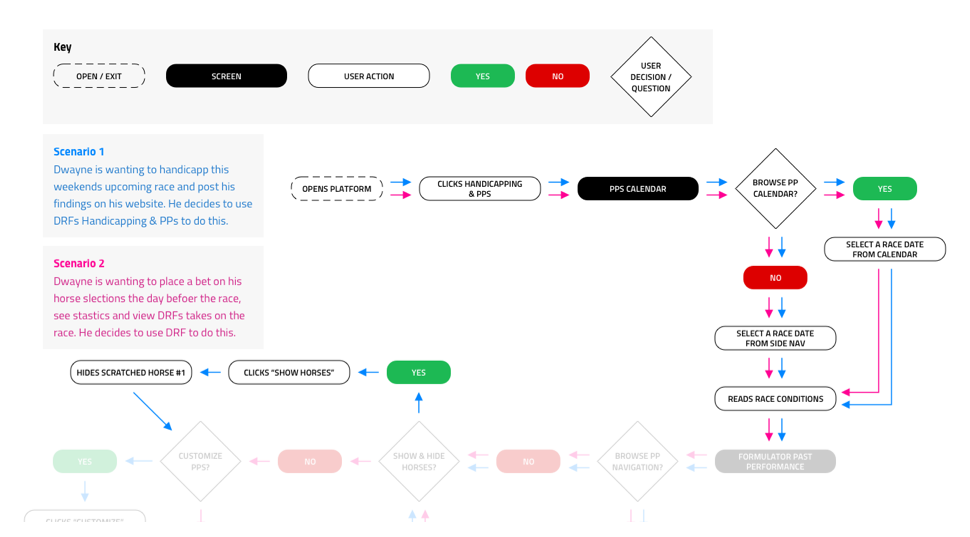
Click to view details
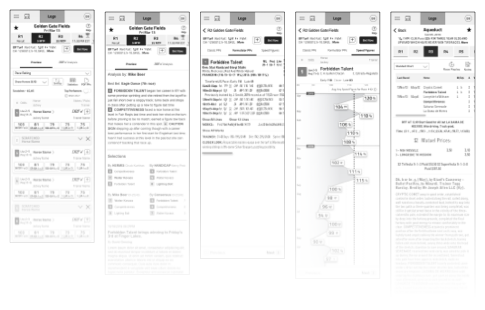
Mid-Fidelity Wireframes
To get a better sense of the functionality and consistency of displaying information in the UI as well as ensuring that what is being displayed is useful, we decided to make a couple wireframes.
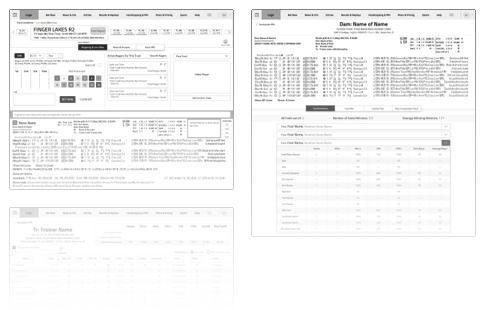
Click to view details
Click to view details
Phase 4
Iterate & Prototype
After many rounds of refinement through iteration based on user feedback and client feedback, we were able to get closer to incorporating a better user experience for various user types using the processes described.
Rapid Iterative Designs
High-Fidelity Prototype
High-Fidelity Prototype
Rapid Iterative Designs
When the initial wireframes were finished, we were then tasked to make refinements to the designs many times through client and user feedback panels, doing this process after many months and rounds we eventually created an agreed-upon design that worked for users and met business needs.
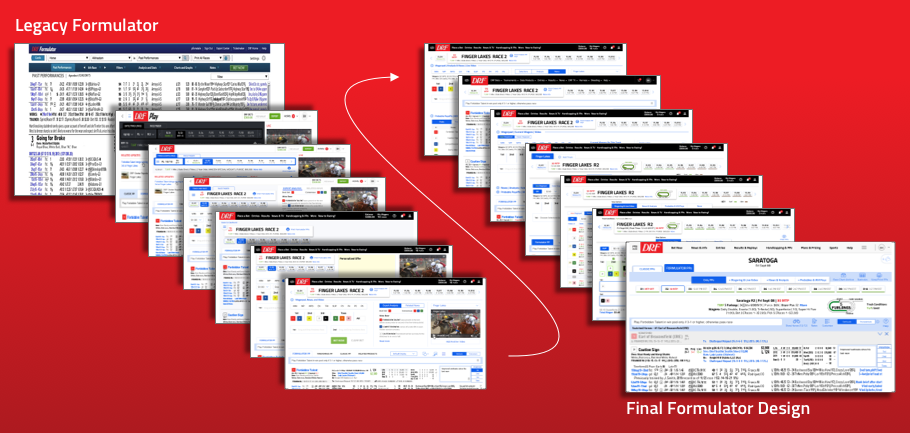
Click to view details
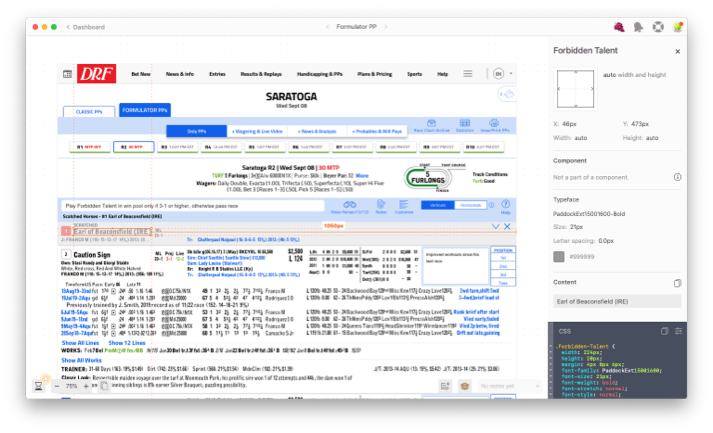
High-Fidelity Prototypes
During the many iterations and usability testing of this product with various users and stakeholders, the following key findings and touchpoints were discovered and grouped:
1. Ability to Switch between Classic and Formulator versions of PPs
2. Quickly switch between; Only PPs, Wager & Live Video, News & Analysis, Probables & Will Pays
3. Bring race nav closer to past performances
4. Group Race Conditions above PPs in a similar format to print version
5. Ability to show and hide horses and see which horse(s) are scratched
6. Ability to quickly take horse, trip, and card notes
7. Customize the way PPs data is displayed
8. Access to Sire, Dam, and Trainer Tools
9. View Race charts in PP lines
10. View Replays from PP lines
Phase 5
Test & Implement
Finally, we have arrived at the stage where we can test the web prototypes with the users before commenting on the code to production. After testing has finished we then Handoff the key designs to Devs for coding to production
Usability Testing
Handoff Key Designs to Devs
Handoff Key Designs to Devs
Usability Testing
I conducted 5 in-person interviews and had each participant perform certain tasks based on different scenarios. I was able to collect valuable usability feedback from each participant.
Test Objectives
- Test if users can accomplish tasks successfully
- Identify areas of difficulty with the desktop and mobile design that can be improved
- Determine the overall usability of the platform
- Test if users can accomplish tasks successfully
- Identify areas of difficulty with the desktop and mobile design that can be improved
- Determine the overall usability of the platform
Tasks
- Handicap, take notes, watch replays and live video for a race this coming weekend
- Place a bet on a couple of horses based on your handicapping or DRF Analysis
- Use Sire, Dam, Trainer Pattern, and Race Charts to Handicap your race
- Handicap, take notes, watch replays and live video for a race this coming weekend
- Place a bet on a couple of horses based on your handicapping or DRF Analysis
- Use Sire, Dam, Trainer Pattern, and Race Charts to Handicap your race
Handoff Key Designs to Devs
After extensive testing and gathering feedback from users, we then would make appropriate changes to the designs, and test them again. After fixing issues we would then hand off key designs to devs using a tool such as Zeplin.io. Devs then make the devs on stage and we would then QA the designs before they get sent into production. Once in production, we would then be able to gather analytics and conduct further testing on a wider audience of users
Outcomes & Results
In the end, we learned that users of DRFs new and improved past performance and wagering products were a hit for existing users and some new users. I believe our goal and outcome “to create a differentiated, essential, frictionless ecosystem for handicapping, note-taking, bet construction, and race watching all in one place” was successful. However, the platform is not 100% perfect and I think we can still improve on catering to the needs of users who are new to horse racing, handicapping, and betting by improving on the current platform through onboarding, and continued updates. We also learned that users enjoy an interface that is robust but simple to use and that there is an opportunity to give information in easier-to-digest ways without interrupting the quality of content for all users.
What's next?
Next in the development life cycle is testing, reviewing, and measuring if what we made has truly benefited the users and then start the process over again. Since the project is never over, it requires continuous updates and refinement to meet the ever-growing demands of the horse racing industry market and changes in user needs and behaviors. Some areas I imagine DRF would want to work on in the future is upgrading its UI to meet the needs of users who are new to horse racing, betting, and handicapping.